
Using TESS data, researchers have mapped out an all-sky set of red giant stars based on stellar measurements, creating a stellar symphony based on their vibrations.
CREDIT: NASA’s Goddard Space Flight Center/Chris Smith (KBRwyle)
I feel like we’ve reported on a lot of TESS stories lately, and that’s actually unsurprising as the TESS Science Conference has been going on this week. I thought all the stories coming out would be about exoplanets, but it turns out, the instruments on TESS are sensitive enough to collect all kinds of data about stars, not just exoplanet transits.
In work presented at the conference, Marc Hon gave an overview of a new all-sky map of red giant stars based on stellar measurements collected over the first two years of the TESS mission. The team was able to determine the masses and sizes of these stars across almost the entire sky, and in doing so, also measured the oscillations of the red giants, creating a symphony.
The press release explains these oscillations by comparing them to sound waves made by everyday music instruments such as guitars. When the string is plucked, it oscillates, and the sound waves can reflect, interact, amplify each other, or cancel themselves out. The same thing basically happens in stars, too, with hot gas rising, cooling, sinking, heating, and rising again. This process produces waves of pressure changes that act just like sound waves — interacting with each other and creating standing waves for minutes at a time that change the brightness of the star. In our own Sun, the changes would be on the order of parts per million, but with these red giants, the pulses happen more slowly and the brightness change can be hundreds of times larger.
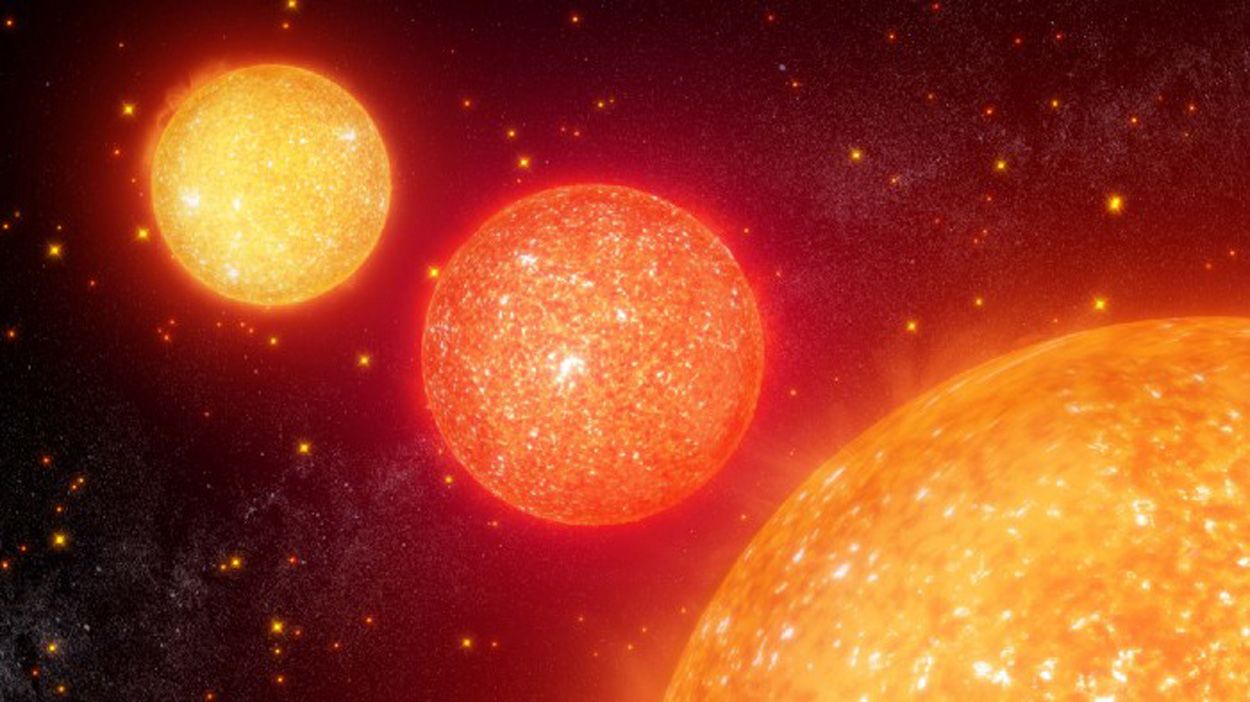
Now, just as there are differences between the tones of guitar strings, violin strings, and even cello strings, so, too, are there differences between the pulses in the red giants. These also depend on size and mass as well as other fundamental properties such as the interior structures of the stars. Stars like the Sun eventually expand out into red giants, increasing in diameter by a factor of 10 or more, and that larger distance results in longer wavelengths and larger amplitudes. Using TESS, we can observe millions of fainter, more numerous stars and measure their pulsations.
During the primary mission of TESS, in those first two years, the spacecraft monitored about 75% of the sky, with each camera capturing a 24-by-24-degree image every thirty minutes. When the mission was extended last year, the pace of the image collection increased to every ten minutes. From these images, light curves were developed that measured the change in brightness of nearly 24 million stars over 27 days. That’s how long TESS monitors a section of the sky. And, that’s a LOT of data.
All that data was then analyzed using a machine-learning algorithm that was trained using light curve data from 150,000 stars observed by the Kepler mission. The TESS data turned up 158,505 pulsating red giants. Then the team used even more data from the Gaia mission, which gave them the distances to the star. Once everything was analyzed, the masses of the stars were plotted across the sky. The press release explains: Stars more massive than the Sun evolve faster, becoming giants at younger ages. A fundamental prediction in galactic astronomy is that younger, higher-mass stars should lie closer to the plane of the galaxy, which is marked by the high density of stars that create the glowing band of the Milky Way in the night sky.
And coauthor Daniel Huber sums up the work by saying: Our map demonstrates for the first time empirically that this is indeed the case across nearly the whole sky. With the help of Gaia, TESS has now given us tickets to a red giant concert in the sky.
The full paper will be published in The Astrophysical Journal.
More Information
- NASA Goddard press release
- “A ‘Quick Look’ at All-Sky Galactic Archeology with TESS: 158,000 Oscillating Red Giants from the MIT Quick-Look Pipeline,” Marc Hon et al., to be published in The Astrophysical Journal (preprint on arxiv.org)
This article originally appeared on Medium, August 9, 2021.


