Farewell to an old friend. Rosetta's signal disappears from the Allen Telescope Array's tracking.
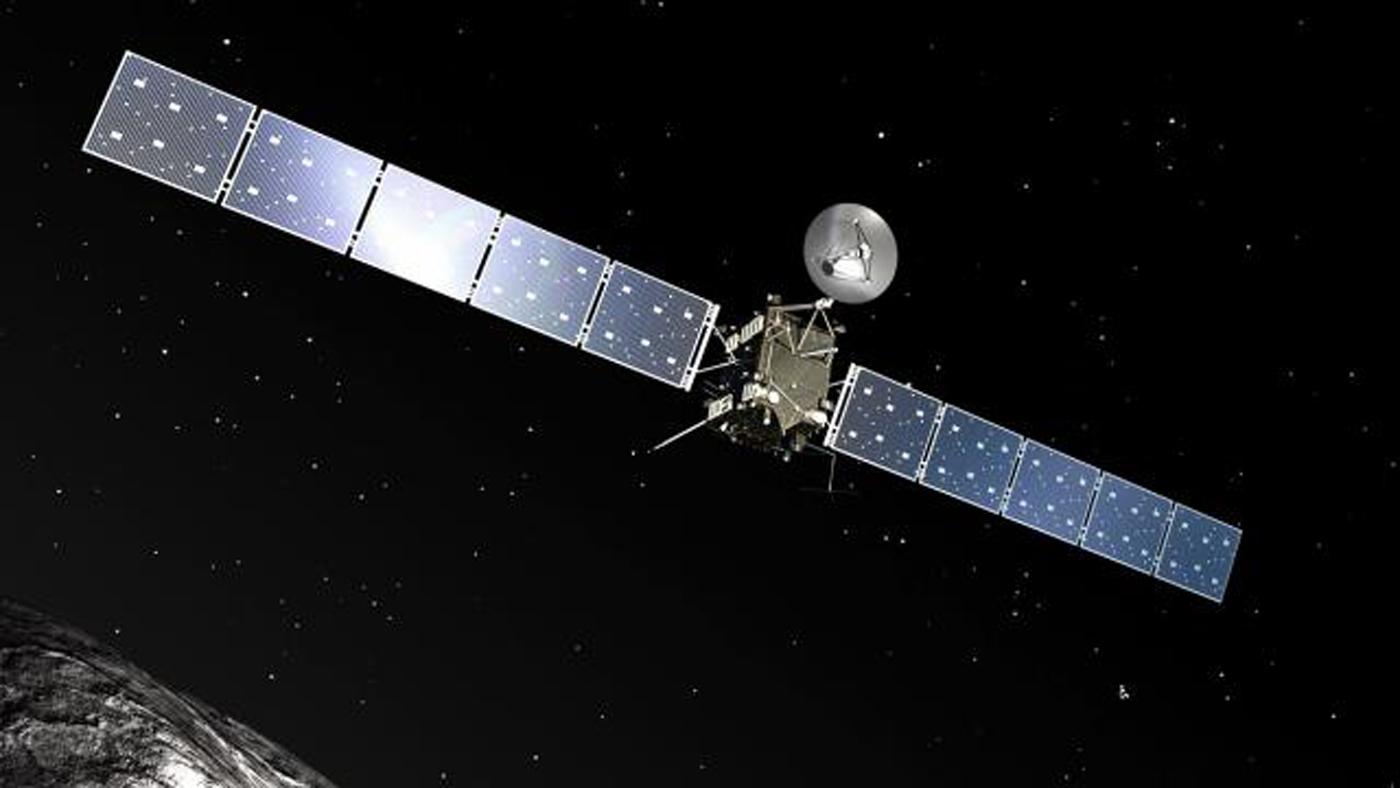
As Rosetta crashed into comet 67p, it dipped below the horizon for the last time as seen from the Allen Telescope Array (ATA) at 05:55pm Pacific time, September 29, 2016. I've used its signal a lot over the years to test our receiving system. Now I'll have to find another spacecraft!
For 12+ hours a day we use the ATA to search for radio transmissions from distant stars and planets. But it was a nice warm afternoon, nobody else was using the 42-dish radio array, and Rosetta was going to set for the last time, so for the 1 hour and 25 minutes as that happened, I tuned the ATA to track the spacecraft. I also randomly pointed my webcam at myself and around the room, out the door, and through the glass windows into the computer room.
The actual "exciting" part is where the Rosetta signal sets at the end, at about 01:24. You can see the green vertical line disappear. Our receiving horizon is 16.5 degrees above the horizon and the Rosetta signal was no longer visible as it passed through 16.5 degrees.
There is no audio. This is because It was a warm afternoon and the air conditioning for the control room at the ATA is broken, so I blasted the back of my MAC with a very large, loud fan to keep the computer, which was hot to the touch, cool once I started streaming video to YouTube. You would have never heard the audio over the fan noise.
Here is a short explanation of what you are seeing. These are common methods of visualizing radio signals for data and scientific analysis.
- The green plot is what is called a constantly scrolling up "waterfall" plot.
- The horizontal axis is frequency, the vertical is time, and the brightness is intensity, or power, of the signal.
- The actual signal appears as a straight line, but actually it is a tiny bit slanted because of the Doppler Effect. See https://en.wikipedia.org/wiki/Doppler...
- The red plot is a spectrum plot. The horizontal axis is frequency; the vertical axis is intensity, or power.
The strong signal that shows up in both is Rosetta's radio transmission carrier; see http://searchtelecom.techtarget.com/d... for an explanation of what that is. If you watch the whole video, you will see signals occasionally show up on the left and right side. Those are the sidebands which contain the data Rosetta is transmitting back to Earth. See https://en.wikipedia.org/wiki/Sideband
Jon Richards is the SETI observer at the ATA. To follow nightly observations, visit our real-time observing site at http://setiquest.info.